How to Design a Fully Interactive, Reactive, and Dynamic Terminal-Based Data Dashboard Using Textual?
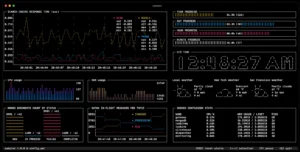
Terminal applications are making a massive comeback—this time with interactivity, animations, powerful UI components, and real-time data capabilities. Thanks to Textual, the modern Python framework created by Textualize, developers can now build terminal interfaces that feel almost like web apps. Imagine a fully interactive, reactive, and dynamic data dashboard running in the terminal with charts, panels, tables, live updates, hotkeys, theming, and responsive layouts.
In this in-depth guide, you’ll learn exactly how to design such a dashboard from scratch using Textual—covering architecture, UI components, data reactivity, state management, and sample code to get started.
✨ Why Terminal Dashboards Still Matter in 2025
While web dashboards dominate today’s analytics space, terminal dashboards serve several important use cases:
-
Developers want quick, distraction-free analytical views inside CLI workflows
-
SREs, DevOps engineers, and sysadmins need real-time server monitoring
-
Terminal dashboards can run on remote SSH sessions with no GUI
-
They consume minimal resources and are blazing fast
-
They can be bundled with Python scripts for data tools and automation
Textual makes all of this possible without touching curses or low-level UI libraries.
🔍 What Is Textual? A Quick Overview
Textual is a modern TUI (Text User Interface) framework written in Python by Textualize (the creators of Rich). It provides:
-
A CSS-like styling system
-
A widget-based UI model
-
Reactive state variables
-
Asynchronous updates
-
Keyboard & mouse interactivity
-
Built-in components like tables, buttons, trees, charts, markdown, etc.
-
A virtual DOM system similar to React
This means you can create rich interfaces with structured layouts and update UI components based on state changes—just like modern front-end frameworks.
🧩 Key Concepts for Building a Textual-Based Data Dashboard
Before start coding, let’s understand the three most important concepts:
1. Reactive Programming in Textual
Textual’s reactive variables update the UI automatically when their values change.
Whenever data_count updates, components bound to it automatically refresh.
2. Layouts with Containers and CSS
Textual uses Container, Vertical, Horizontal, Grid, etc., to create layouts.
You also write .css files to define sizing, spacing, colors, and animations.
3. Widgets
A dashboard typically uses:
-
Data tables
-
Log viewers
-
Cards/panels
-
Metric widgets
-
Line/bar charts
-
Menus and keybindings
Textual has built-in and custom widgets that support these functionalities.
🏗️ Core Architecture of an Interactive Terminal Dashboard
A solid architecture allows you to scale, extend, and organize your dashboard.
🔸 1. App Layer (Dashboard Core)
The main app handles:
-
Routing
-
Global state
-
High-level event handling
-
Panel switching
-
External data polling
🔸 2. UI Layer (Widgets + Layout)
This layer contains:
-
Panels
-
Cards
-
Tables
-
Menus
-
Charts
Each widget is isolated and handles its own rendering logic.
🔸 3. Data Layer
Includes:
-
API fetchers
-
Database connections
-
Local data transformations
-
Real-time streaming
-
Async polling loops
🔸 4. State Manager
Uses:
-
reactivevariables for simple states -
A custom Python class for complex shared state
🧱 Designing a Fully Interactive Textual Dashboard (Step-by-Step)
Let’s walk through the entire design process.
Step 1: Install Textual
Step 2: Create the Project Structure
Step 3: Build the Layout Structure
You’ll divide the screen:
-
Top: Header (with current time, data source status)
-
Left: Navigation menu
-
Center: Charts & metrics
-
Bottom: Logs or event output
Textual makes this easy with containers.
Example Layout:
Step 4: Add Reactive State
When updated, the UI reacts automatically.
Step 5: Fetch Data in Real Time (Async Tasks)
Textual supports asyncio tasks that run in background:
Then schedule it on app startup:
Step 6: Build Stats Panels
Stats widgets are small cards showing metrics like:
-
CPU load
-
Memory usage
-
API requests
-
Active users
Sample widget:
Connect reactive variables via messages or direct link.
Step 7: Create Charts
Textual’s native chart widget (Plot) allows drawing:
-
Line charts
-
Bar charts
-
Scatter plots
Example:
Step 8: Build a Reactive Data Table
Tables are crucial for dashboards.
Step 9: Add Keyboard Shortcuts
Step 10: Add Styles with CSS
A sample styles.css:
Textual’s CSS-like system dramatically improves look and usability.
🎛️ Interactivity Features to Add
A good dashboard is not just visual—it’s interactive.
Here are must-have interactivity features:
🔹 Live search in tables
Users can type to filter rows dynamically.
🔹 Panel switching
Pressing keys to switch between:
-
Logs
-
Metrics
-
Charts
-
Settings
🔹 Resizable panels
Textual supports drag-to-resize components.
🔹 Theme switching (dark/light)
A simple global state change updates the whole UI.
🔹 Pop-up dialogs
Useful for:
-
Confirmations
-
Notifications
-
Input prompts
📡 Real-Time Data Integrations
Your dashboard can connect to:
-
APIs (REST/GraphQL)
-
WebSockets
-
Kafka streams
-
Local CSV/JSON
-
System metrics
-
Prometheus
-
Docker stats
-
Redis
-
Sensor data
Use asyncio to poll or subscribe without blocking UI.
📦 Packaging Your Dashboard
You can distribute your project as:
-
A pip package
-
A standalone CLI tool
-
A system monitoring tool
-
A part of automation scripts
🚀 Deployment Options
Terminal dashboards can run:
-
On local machine
-
On cloud servers
-
On remote Linux machines via SSH
-
Inside Docker containers
-
In CI/CD as real-time monitors
-
On Raspberry Pi devices
🛠️ Example: Complete Minimal Dashboard Code (Simplified)
🎨 Enhancing the Dashboard (Advanced Techniques)
Once the basics work, add features like:
1. Smooth Animations
Using CSS transitions and event triggers.
2. Multi-page routing
Switch between different dashboard screens.
3. Component reuse
Build reusable cards, charts, and metric widgets.
4. Integrate machine learning predictions
Real-time anomaly detection or forecast charts.
5. Custom Charting Widgets
Using Rich to draw ASCII charts.
🌟 Best Practices for High-Quality Textual Dashboards
-
Use non-blocking async for data fetching
-
Keep widgets modular
-
Define consistent styles in CSS
-
Avoid over-refreshing UI elements
-
Use reactive variables for clean updates
-
Provide shortcuts for power users
-
Make layout responsive on small terminals
-
Add error handling for API failures
📘 Final Thoughts: Textual Makes Terminal Dashboards Beautiful Again
Terminal dashboards in 2025 are more powerful than ever—thanks to Textual. You can build a real-time, interactive, reactive, dynamic data dashboard that would previously require web frameworks, but now runs entirely inside your terminal.
Whether you’re a Python developer, DevOps engineer, system admin, or data enthusiast, Textual gives you everything you need to create stunning, production-ready terminal UIs.
For quick updates, follow our whatsapp –https://whatsapp.com/channel/0029VbAabEC11ulGy0ZwRi3j
Anthropic Turns MCP Agents Into Code-First Systems With the ‘Code Execution with MCP’ Approach


